In my last post, I covered the speech rate problem as I perceived it. Understanding the theory of what is going on is half the work. I decided to make a cross-platform speech rate benchmark that would allow me to identify how well each platform conforms to rate changes.
So how do you measure speech rate? I guess you can count words per minute. But in reality, all we want is relative speech rate. The duration of each utterance at given rates should give us a good reference for the relative rate. Is it perfect? Probably not. Each speech engine may treat the time between words, and punctuation pauses differently at different rates, but it will give us a good picture.
For example. If it takes a speech service α seconds to speak an utterance, it should take it α/2 seconds to to say the same thing with a rate of 2.0, or 2α at a rate of 0.5. If we want to measure the engines rate compliance across a set of different rates, we first get the utterance time with a “normal” rate of 1.0, and then the rest is simple division.
I wrote a tool to do just this. Play around with it. It is fun.
Speech Rates in OSX
As I mentioned in the previous post, it looks like our OSX speech support is the only platform where we actually got it right. Running the rates benchmark on the Alex voice gives us these results:
|
Voice
|
1/2.5
|
1/2.25
|
1/2
|
1/1.75
|
1/1.5
|
1/1.25
|
1
|
1.25
|
1.5
|
1.75
|
2
|
2.25
|
2.5
|
|
Alex
|
0.415
|
0.459
|
0.521
|
0.593
|
0.688
|
0.826
|
1.00
|
1.27
|
1.52
|
1.75
|
1.99
|
2.23
|
2.48
|
You know what would be prettier than a table? A graph! So I made the benchmark generate a graph that gives a good visualization of the rate distribution. I normalized it with a log10 so that you can get a better idea of distances in the graph. Here is what it looks like for a rate-conforming voice like Alex:
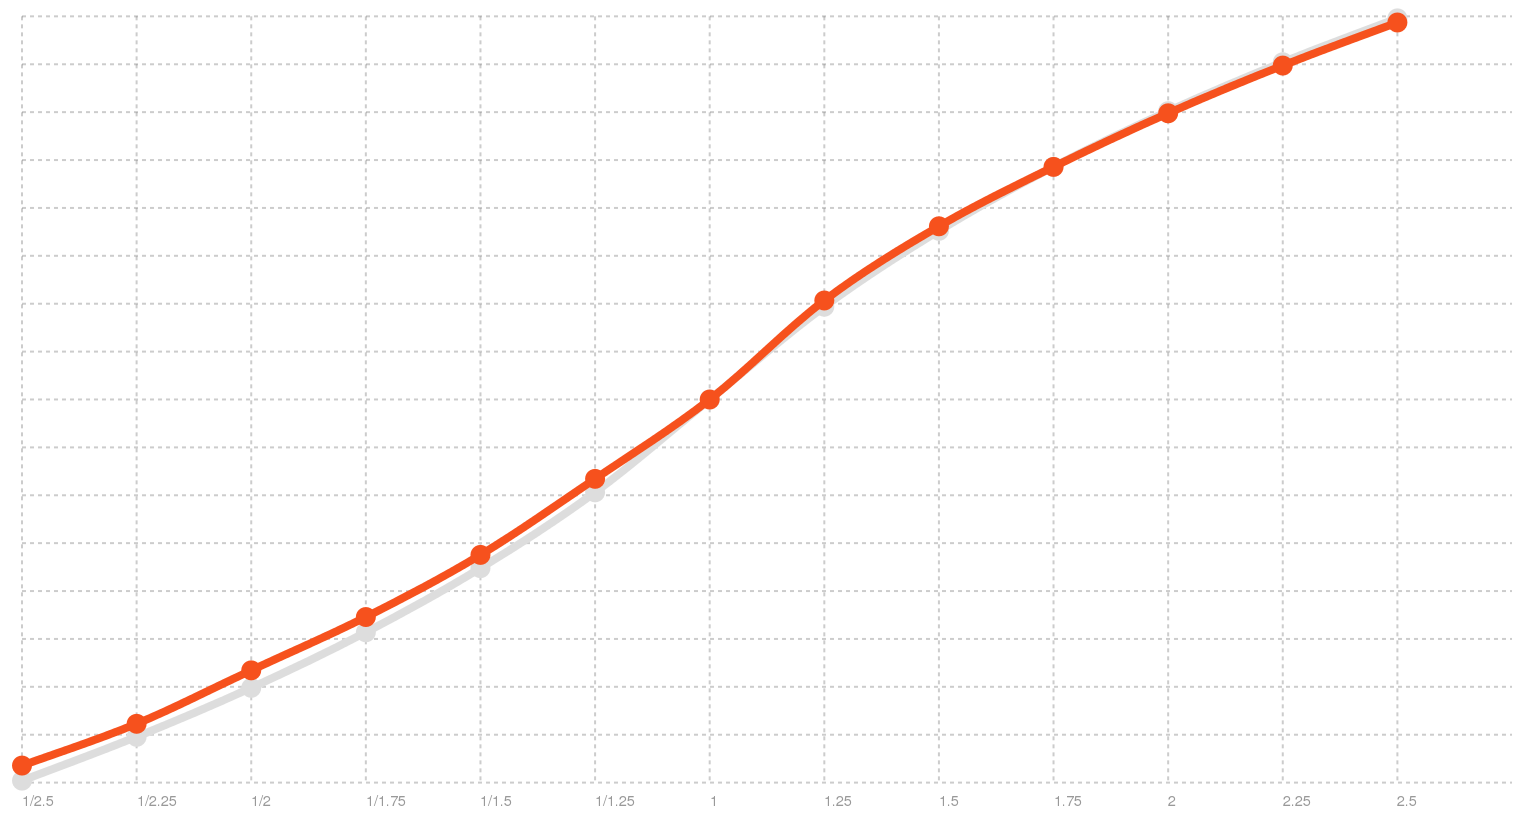 Rate distribution of Alex voice on OSX
OSX voices aren’t perfect. For example, the Hebrew Carmit Voice does not support rates under 0.5 (or above 3, but that is not shown here). If a rate out of the supported range is given, the voice will just go back to its default. That’s not too good! There may be some workarounds to make sure we at least use the max/min rate, but I didn’t check it out yet.
|
Voice
|
1/2.5
|
1/2.25
|
1/2
|
1/1.75
|
1/1.5
|
1/1.25
|
1
|
1.25
|
1.5
|
1.75
|
2
|
2.25
|
2.5
|
|
Carmit
|
0.926
|
0.927
|
0.520
|
0.584
|
0.686
|
0.818
|
1.00
|
1.27
|
1.54
|
1.75
|
2.04
|
2.30
|
2.53
|
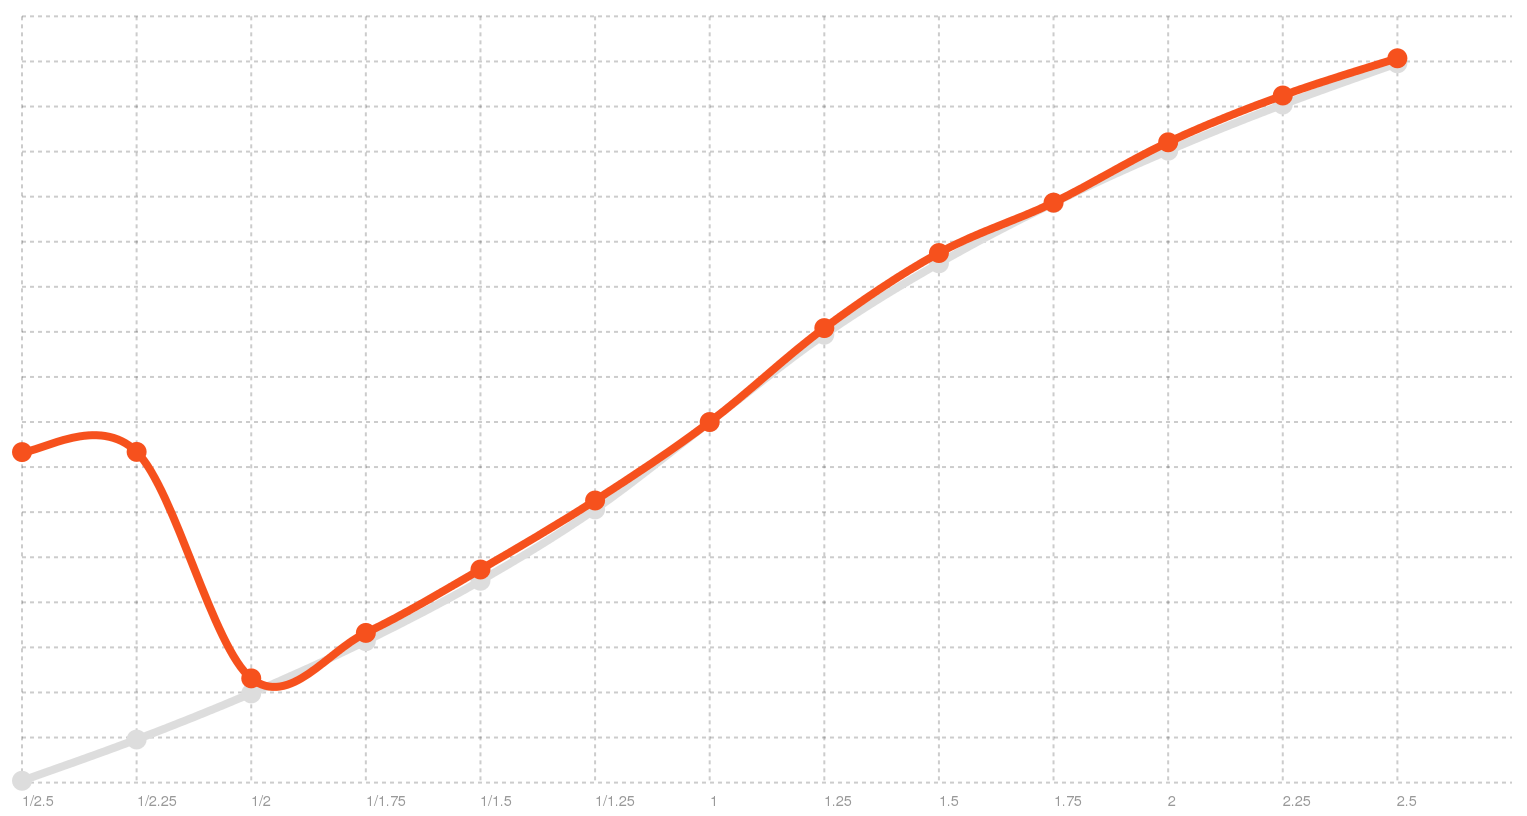 Carmit rate distribution
It could even be worse. OSX has a voice named “Bad News”. Apparently, there is only one rate in which to deliver bad news:
|
Voice
|
1/2.5
|
1/2.25
|
1/2
|
1/1.75
|
1/1.5
|
1/1.25
|
1
|
1.25
|
1.5
|
1.75
|
2
|
2.25
|
2.5
|
|
Bad News
|
0.882
|
0.899
|
0.917
|
0.937
|
0.956
|
0.978
|
1.00
|
1.02
|
1.03
|
1.04
|
1.05
|
1.05
|
1.06
|
 Bad News rate distribution
With a few exceptions, speech rate on OSX is pretty good. Their API and documentation is straightforward enough that we nailed this on the first shot.
Speech Rates in Windows
As mentioned in the previous post, speech rate in SAPI is defined as an integer from -10 to 10. In our initial implementation, we naively assumed that we can take the Web Speech API rate multiplier, and convert it to an SAPI rate by using the 10th root of the value and multiplying it by ten. In effect, projecting the maximal distribution of SAPI speech rates across the allowed Web Speech API values: 0.1 would become -10, 10 would be 10.
With my fancy new benchmark tool, we could get a good picture of where that leads us with the standard David voice:
|
Voice
|
1/2.5
|
1/2.25
|
1/2
|
1/1.75
|
1/1.5
|
1/1.25
|
1
|
1.25
|
1.5
|
1.75
|
2
|
2.25
|
2.5
|
|
MS David
|
0.712
|
0.713
|
0.712
|
0.799
|
0.892
|
0.976
|
1.00
|
0.977
|
1.13
|
1.25
|
1.41
|
1.40
|
1.40
|
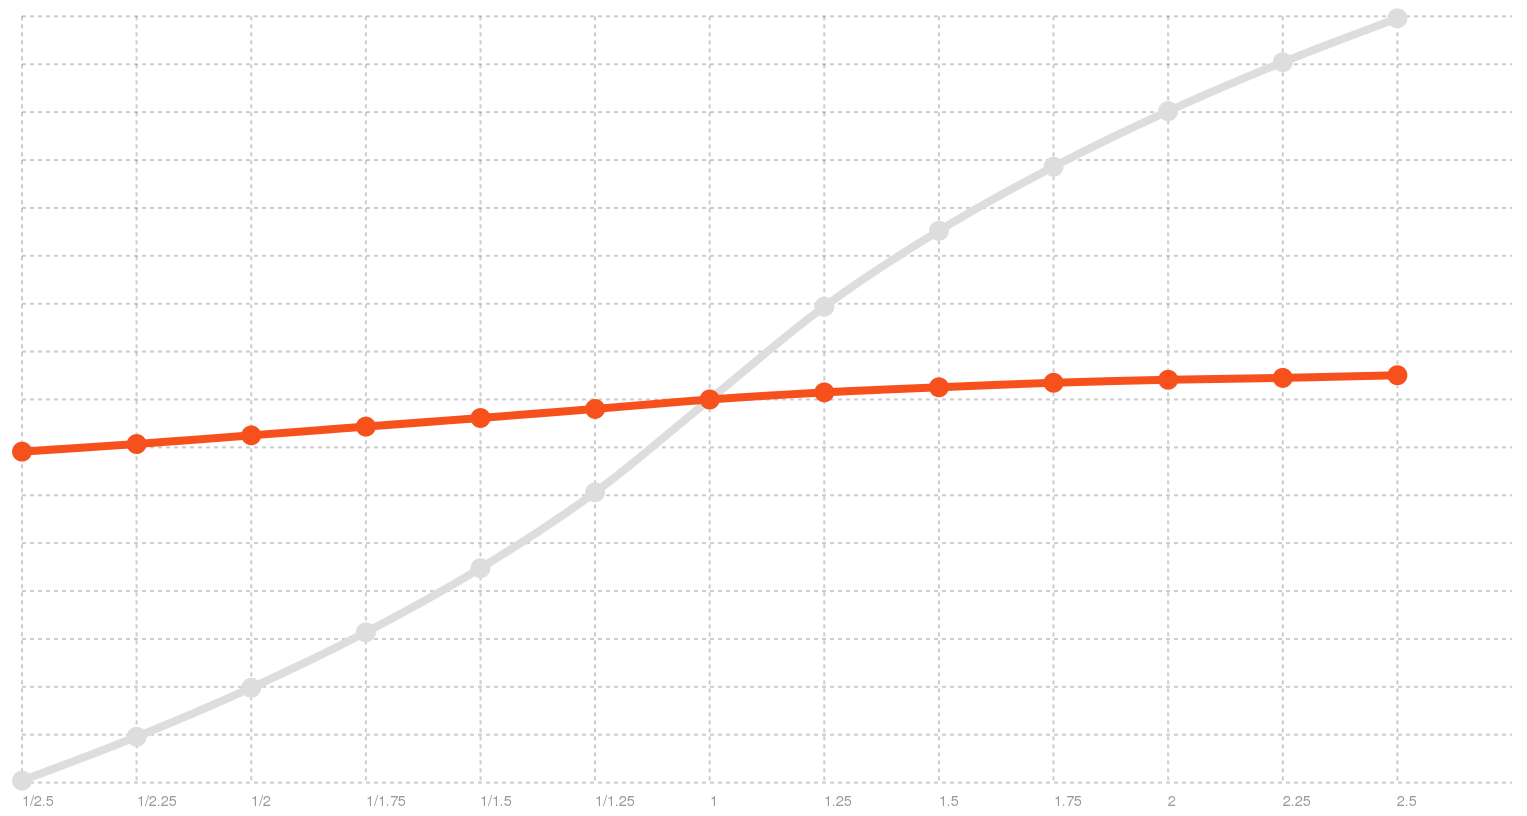
That’s not too good. For example, if you provide a rate of 2.0, you would expect double the normal rate, but you only get 1.41x. Here is a graph:
 Broken rate distribution on Windows
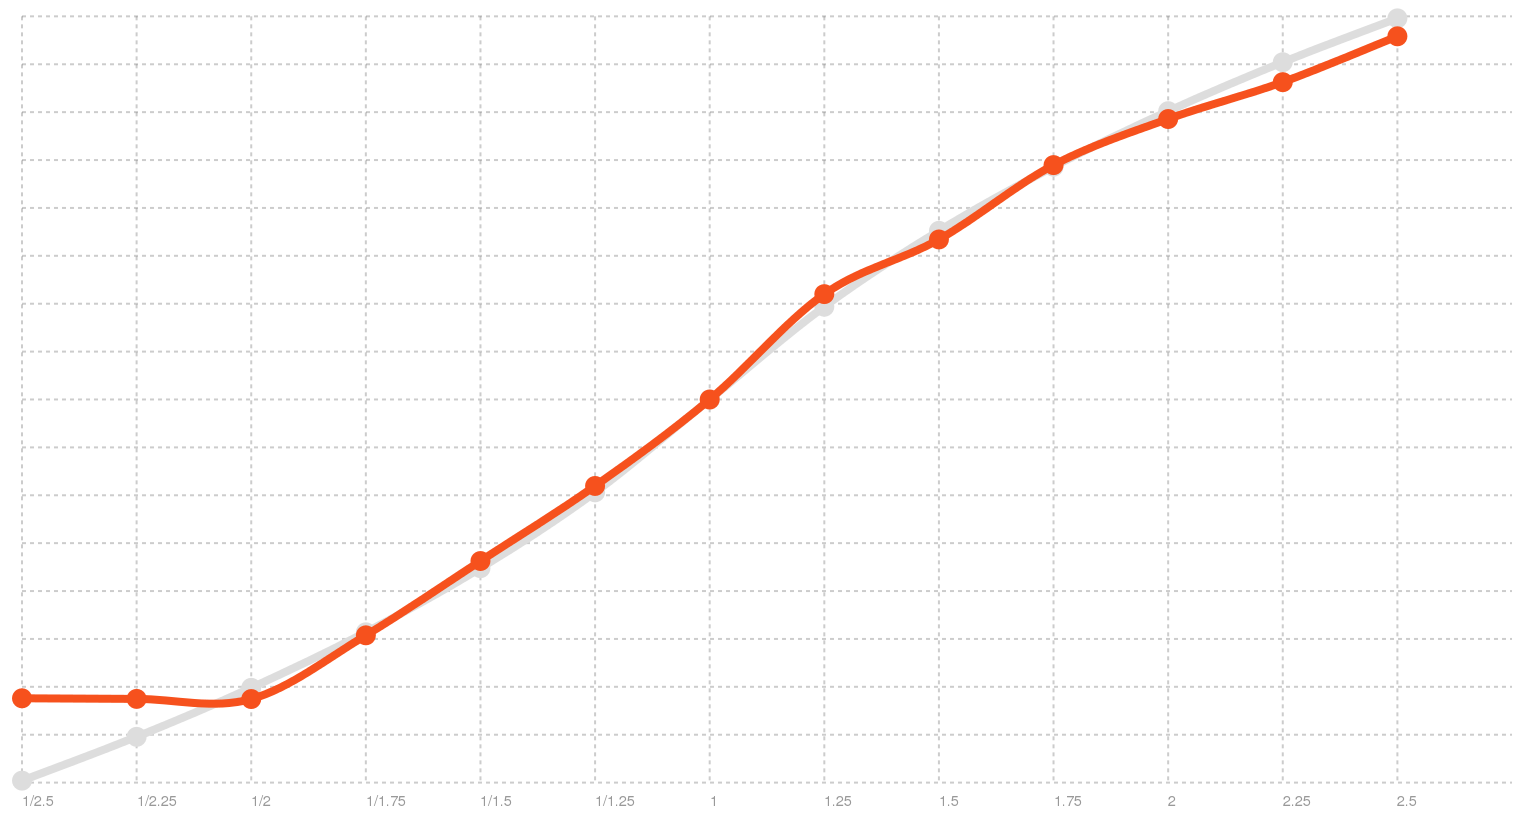
I also mentioned in the previous post, that after digging in MSDN, I found a page that explains what the expected speech engine characteristics are. In essence, 10 in SAPI means three times the normal speed, and -10 is one third. That is something to work with! I fixed the math we do for the rate conversion, and once we correctly projected our multiplier values into what SAPI accepts we got much better benchmark results:
|
Voice
|
1/2.5
|
1/2.25
|
1/2
|
1/1.75
|
1/1.5
|
1/1.25
|
1
|
1.25
|
1.5
|
1.75
|
2
|
2.25
|
2.5
|
|
MS David
|
0.413
|
0.454
|
0.509
|
0.568
|
0.713
|
0.799
|
1.00
|
1.25
|
1.40
|
1.76
|
1.97
|
2.19
|
2.41
|
 Fixed Windows rate distribution
Speech Rates in Linux
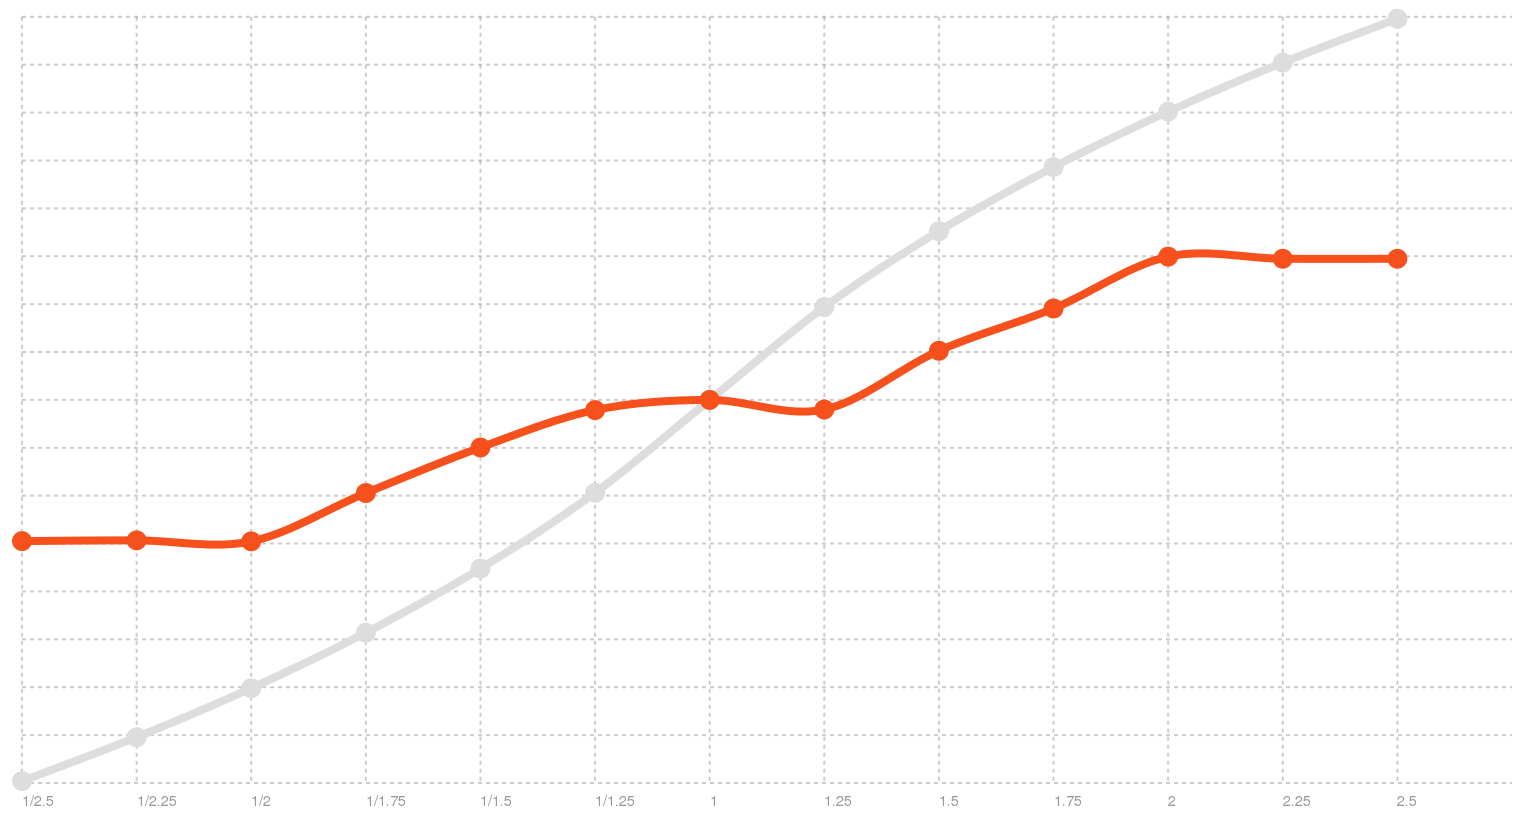
In Linux, we originally had the same naive conversion that we had in Windows, with the only diff being that in Speech Dispatcher the rate is an integer from -100 to 100. The results were just as bad:
|
Voice
|
1/2.5
|
1/2.25
|
1/2
|
1/1.75
|
1/1.5
|
1/1.25
|
1
|
1.25
|
1.5
|
1.75
|
2
|
2.25
|
2.5
|
|
default
|
0.659
|
0.684
|
0.712
|
0.757
|
0.804
|
0.887
|
1.00
|
1.01
|
1.07
|
1.07
|
1.14
|
1.15
|
1.20
|
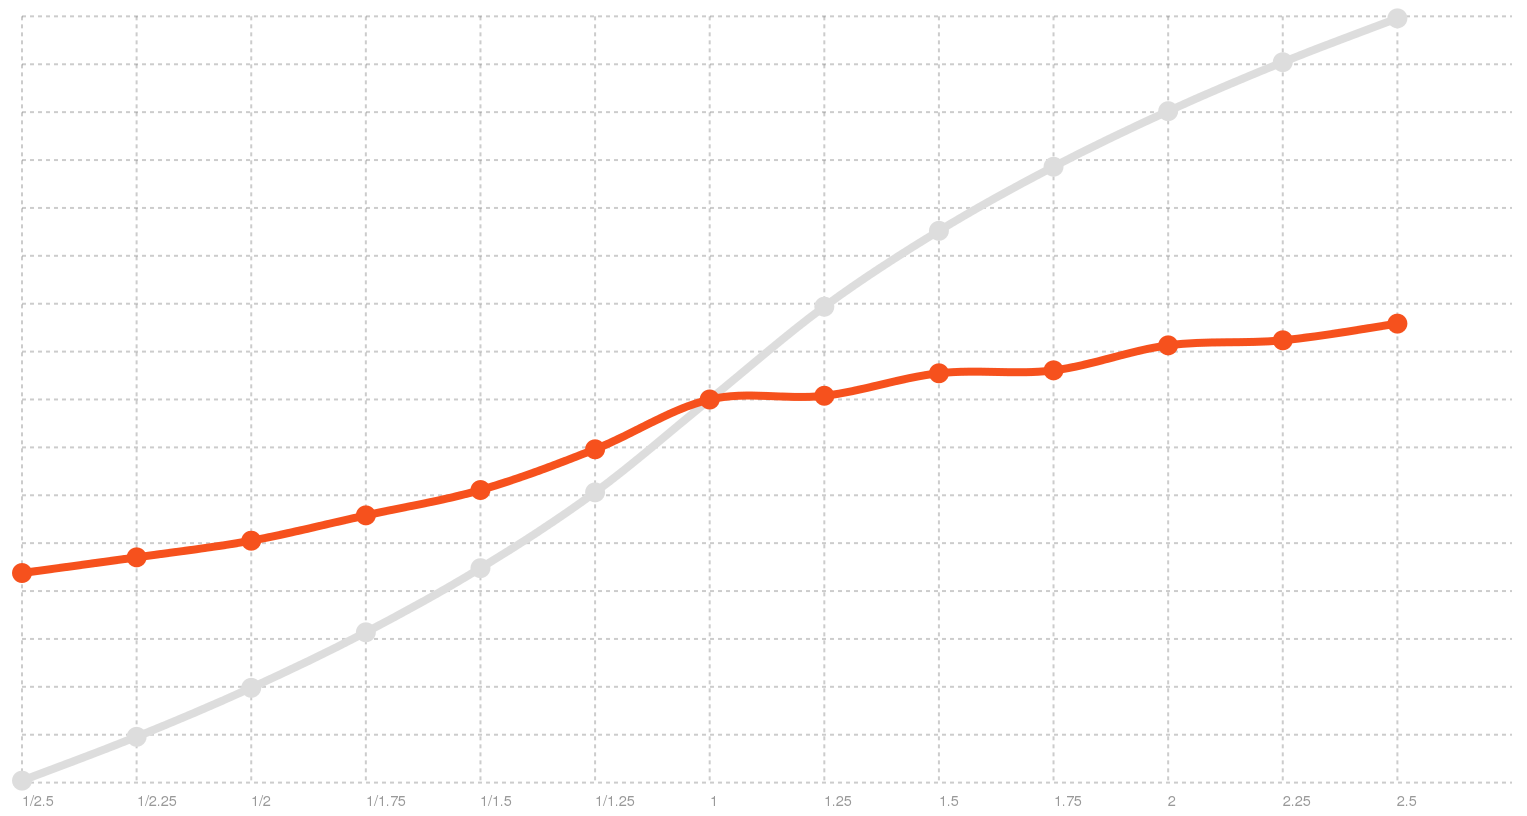 Broken rate distribution on Linux
Speech Dispatcher has limited documentation. But luckily, it is open source, so we just need to read the code, right? I guess. Theoretically. But in this case, it just made me go down a rabbit hole. Speech Dispatcher supports a few engines, but in reality most distributions make it hard to use anything that isn’t eSpeak. I looked at the eSpeak speechd configuration file, and it had some interesting numbers. The “normal” rate is 170 eSpeak words per minute. The max is 390, and the min is 80. In a proportional sense that would be a min rate of 0.47, and a max of 2.3.
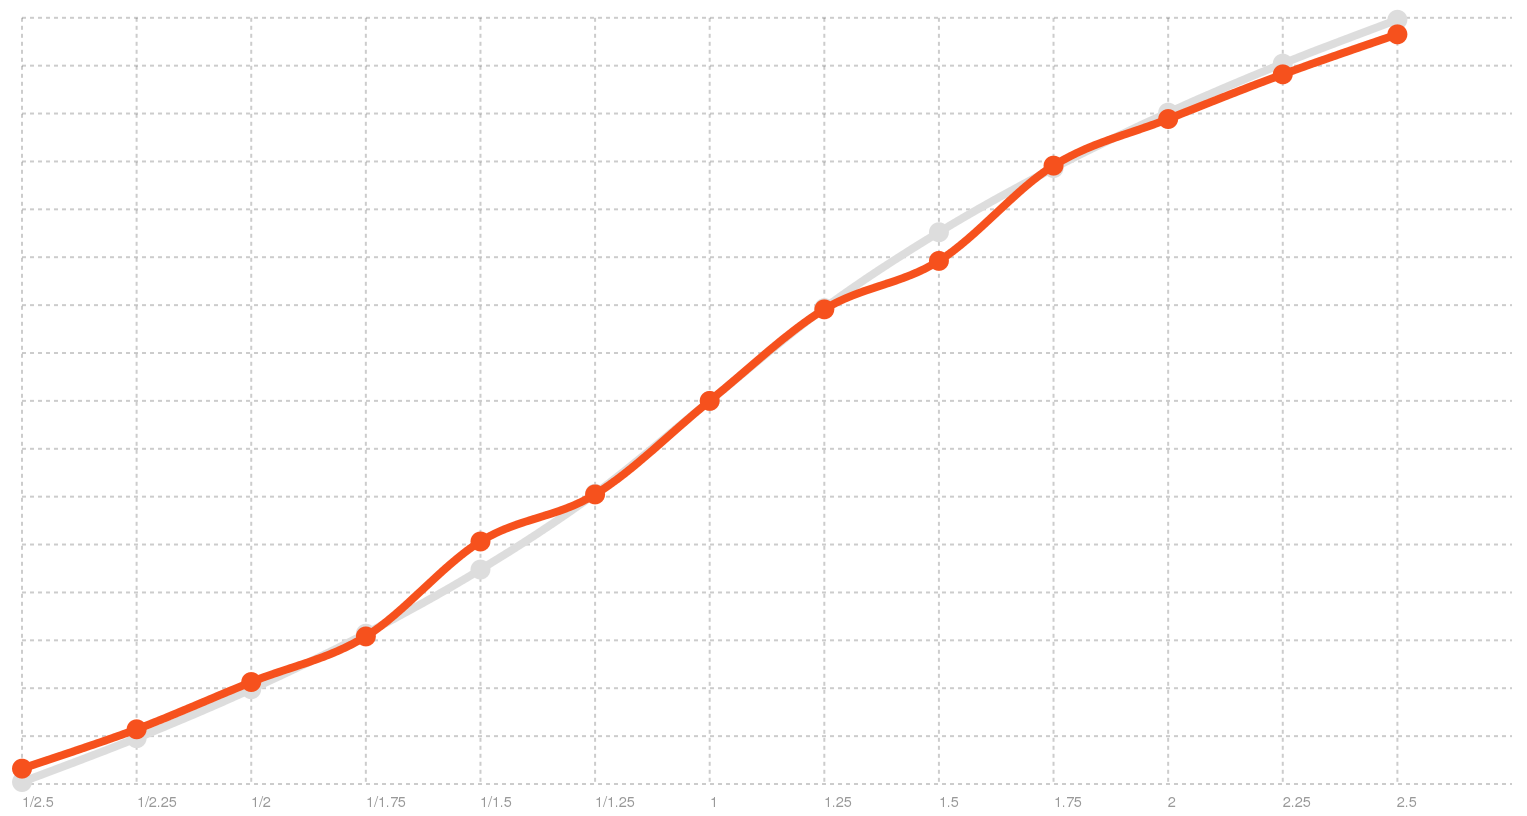
Adjusting the math in our Speech Dispatcher adapter to those theoretical values made things much better, but not perfect. Reading the code of speechd, and its eSpeak output module didn’t reveal anything else. Instead of relying on bad documentation and fallible “source code”, I decided to just go with the numbers I was seeing in the benchmark. Speech Dispatcher rates max out at 2.5x and won’t go below 1/2x. I put those numbers into our conversion formula, and.. it worked well!
|
Voice
|
1/2.5
|
1/2.25
|
1/2
|
1/1.75
|
1/1.5
|
1/1.25
|
1
|
1.25
|
1.5
|
1.75
|
2
|
2.25
|
2.5
|
|
default
|
0.488
|
0.487
|
0.487
|
0.567
|
0.678
|
0.812
|
1.00
|
1.29
|
1.47
|
1.76
|
1.96
|
2.14
|
2.39
|
 Fixed rate distribution on Linux
Conclusion
What’s the lesson to be learned? Not sure. Sometimes the docs are good, other times less so, and sometimes not at all? Benchmarks and real-world results are important?
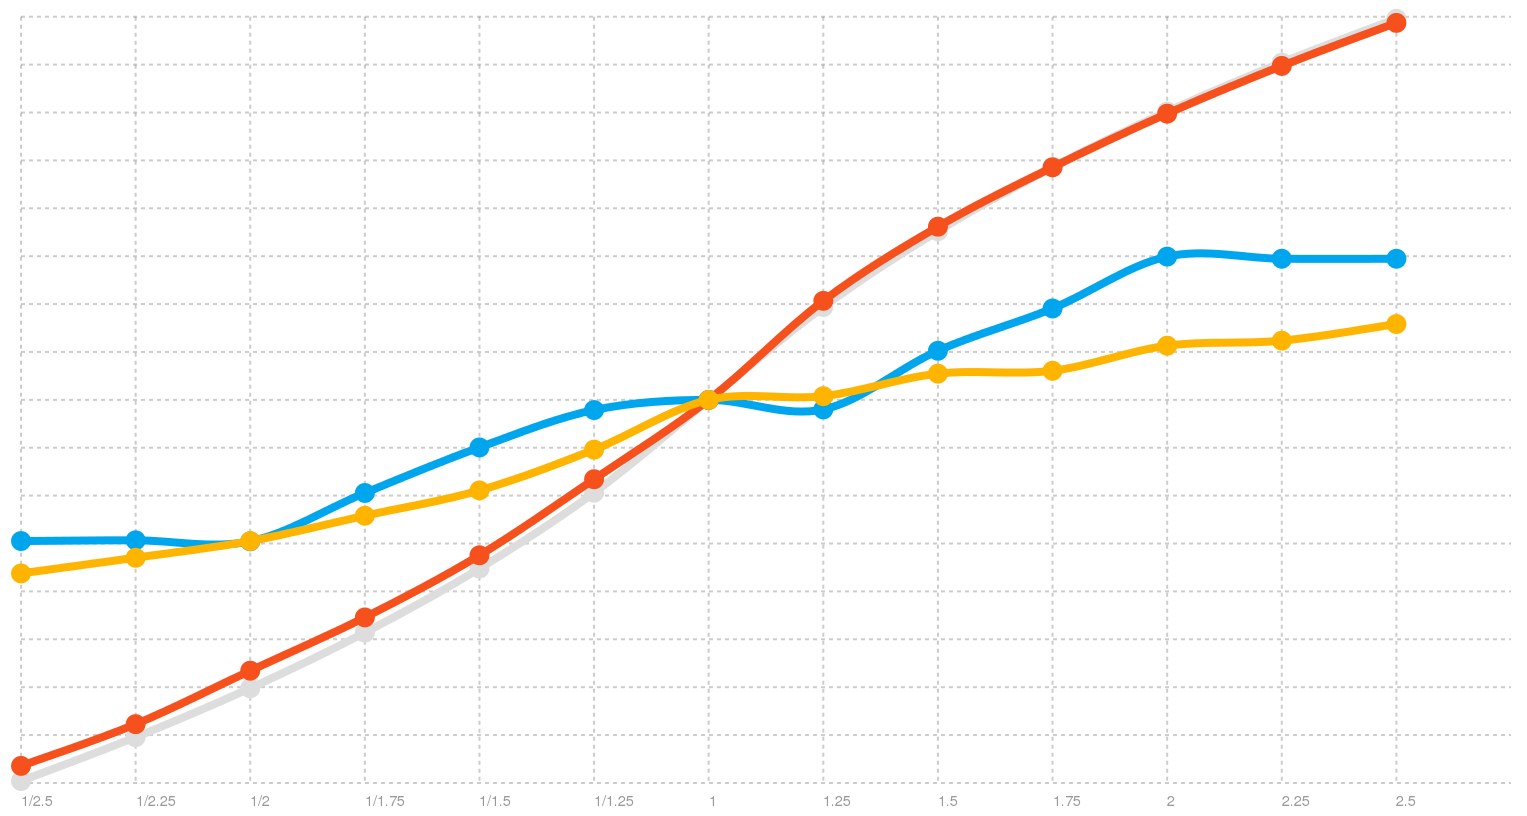
The one certain thing I know now is that graphs are cool. This is what the rate distribution was before I fixed these issues, check it out:
 Rate distribution on all three platforms before fix
And look how clean and nice it is now:
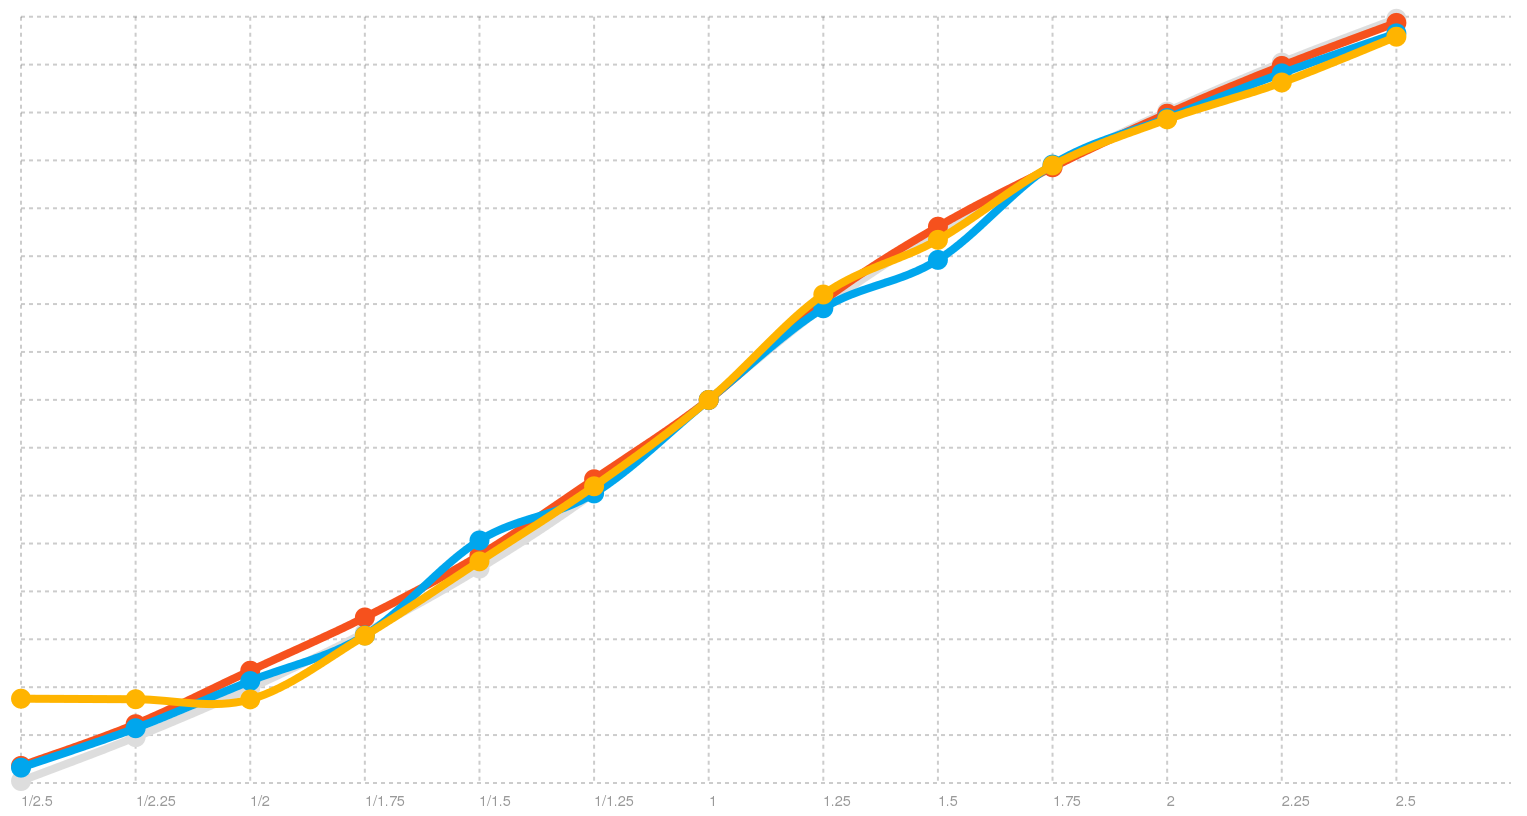 Fixed rate distribution on all three platforms